EXPLORATORY MATERIALS SCIENCE RESEARCH
{loadposition exmsrmenu}
Volume 3 – Issue 2 – 2022
Original Research Article
Colors And Surface Plasmon Resonances Of Low Concentrations Of Silver Nanoparticles In Various Liquid Media
Longlai Yang1, De-Quan Yang1,2*, Edward Sacher3
1Solmont Technology Wuxi Co., Ltd. 228 Linghu Blvd., Tian’an Tech Park, A1-602, Xinwu District, Wuxi, Jiangsu 214135, (CHINA)
2Engineering School, Dali University, 2 Hongsheng Rd, Dali, Yunnan 671000, (CHINA)
3Regroupement Québécois de Matériaux de Pointe, Département de Génie Physique, Polytechnique Montréal, Case Postale 6079, succursale Centre-Ville, Montréal, Québec H3C 3A7, (CANADA)
PAGE NO: 83-91
ABSTRACT – DOI: https://dx.doi.org/10.47204/EMSR.3.2.2022.83-91
Both optical and antibacterial performances are important features of silver nanoparticle (Ag NP) dispersions. Ag NPs, dispersed in water and ethanol, are currently two of the most useful sources of nano silver. We have studied the optical performances of low concentrations of well-dispersed Ag NPs in water, ethanol, butyl acetate, and a mixture of water and glycerin, using UV-Vis spectra at low NP concentrations. We found that the color, surface plasmon resonance (SPR) peak intensities, positions and full widths at half maxima (FWHM) vary with the liquid medium. The concentration-dependent absorptions of the dispersions follow the Beer-Lambert Law, although the concentration/molar absorption coefficient varies with medium and extent of aggregation.
{slider title=”Supplementary Information” open=”false” class=”icon”}

Fig.S1 UV-Vis spectral variations of 10 ppm ethanol-based Ag NPs as a function of water concentration.
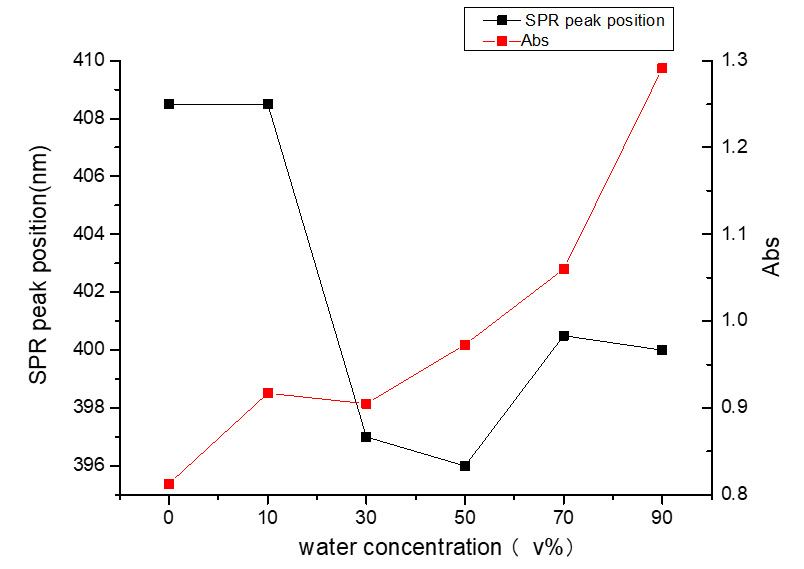
Fig.S2 Surface plasmon peak positions and intensities of 10 ppm ethanol-based Ag NPs as a function of water concentration
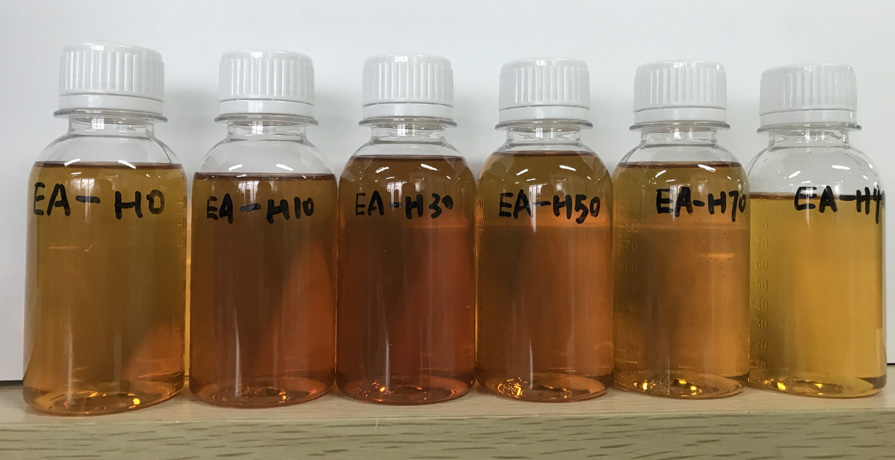
Fig.S3 Color changes of 10 ppm ethanol-based Ag NPs as a function of water concentration. Water concentration is 0,10, 30,50, 70, and 90%, respectively,
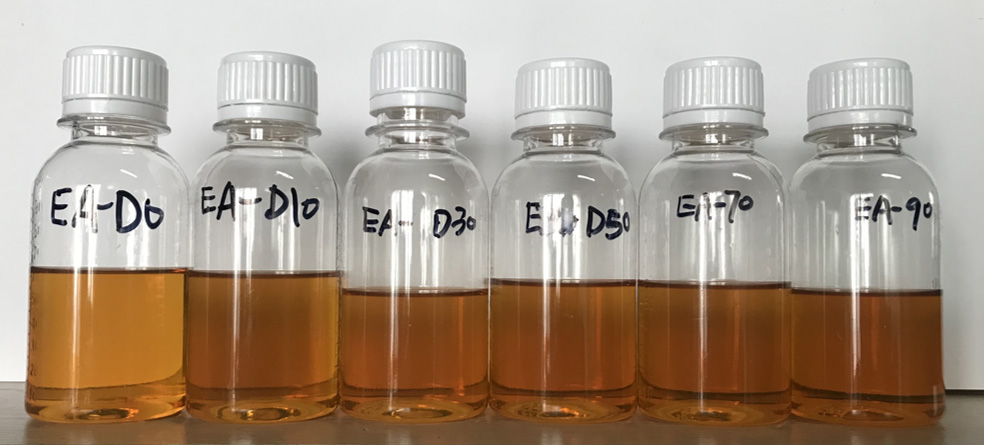
Fig.S4 Color changes of 10 ppm ethanol-based Ag NPs as a function of butyl acetate concentration, Butyl acetate concentration is 0,10, 30,50, 70, and 90%,
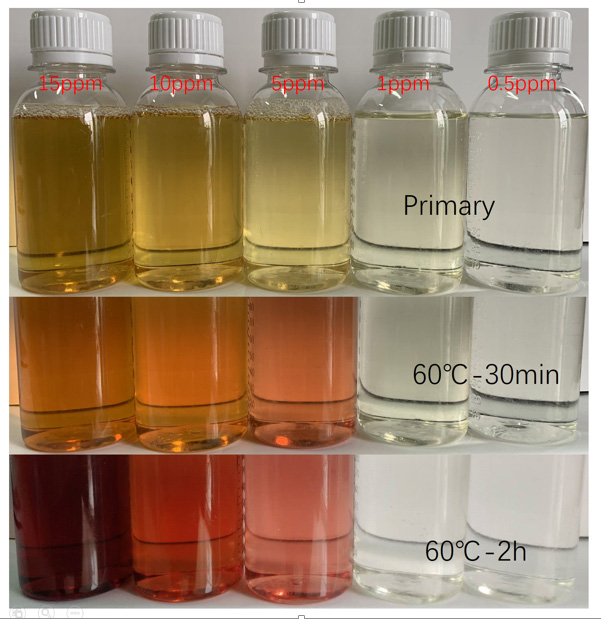
Fig. S5 Color changes of different Ag NP concentrations as a function of aggregation caused by heating.
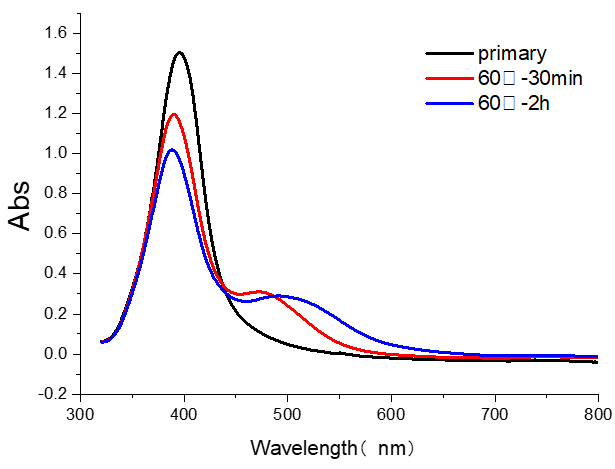
Fig.S6 UV-Vis spectra of 10 ppm PVA-based Ag NPs as a function of aggregation caused by heating
{/sliders}